Reports
Every report on the Reports page, what each one counts, and — the part that matters when two numbers disagree — what each one deliberately leaves out.
Using the page
Reports — "Sales, inventory, purchasing, tax, margin, and period P&L for this store." Pick a category chip (All, Sales, Inventory, Purchasing, Accounting, Cash), then a Report from the list.
Date controls change with the report: From/To for a range, As of for a snapshot, YTD through for a year-to-date figure. Then Export CSV, Export PDF, Print or Refresh.
Export PDF fetches the data and builds the file locally ("Fetching report data for PDF…" then "Building PDF in this browser…"), so it always matches the filters on screen. It is headed with the store name and code, the range and the currency.
Two rules that apply everywhere
- Only completed sales count. Almost every sales figure is limited to orders with the status completed. Parked, held and open tickets never appear anywhere; nor does anything voided, unless a report says otherwise.
- Training-mode sales are excluded. Anything rung up in training mode is kept out of every sales, tax and margin figure.
Dates and times are always in the store's own timezone, never the timezone of whoever is looking. A sale rung up at 23:35 in New York is that day's takings in New York, and it still reads 23:35 to an owner checking from London. That boundary is not cosmetic: it is the same one the day close, the cash reconciliation and the accounting period hang off, so a late sale that slid into the neighbouring day would land in the wrong day's money.
The store's timezone is set in Settings → Store → Timezone. If a store has none recorded, times are shown in UTC — the same for every viewer, and deliberately not your browser's clock, because a plausible-looking local time would hide the fact that nobody has set it. See Companies, stores & registers.
Sales
Daily / period sales
"Orders, totals, tax, discounts — with prior-period compare." Tiles: Orders, Gross total, Subtotal, Tax, Discounts, Tips, with the previous period alongside for comparison.
Counts completed, non-training orders, bucketed by store-local date. Leaves out voided, parked and open tickets, and training mode.
A refund is recorded as a return line on a sale, not as a separate status. This report adds up order-level totals and never looks at the lines, so refunded value is included here — while the category, top products and margin reports strip it out. If "Daily sales" and "Estimated margin" disagree on revenue, this is usually why.
Sales by hour
"Store-local hourly buckets." Same inclusion rules as daily sales. All 24 hours are always shown, with zeroes where you were shut — which is what makes it readable as a staffing picture.
Sales by tender
"Cash, card, and other captured payments." Counts payments with the status captured on completed, non-training orders. Leaves out payments that were authorised but never captured, and any failed, voided or refunded payment row. This is the report to reconcile the drawer against, because it counts money that actually landed.
Sales by cashier
"Staff performance and void counts." The one report that deliberately includes voids: it covers completed and voided orders, so a void count sits next to each person's takings. The money columns still only count completed sales; the void column only counts voided ones. Training mode is still excluded.
By category / department
"Revenue rolled up by department or category." Works at line level, so it is the strictest so far: completed, non-training orders, and within them voided lines and return lines are both dropped. Deleted departments and categories do not appear.
Top products
"Best sellers by revenue." Same line-level rules as above — no voided lines, no returns — limited to the number of rows you ask for.
Voids & discounts
"Voided orders and discounted tickets." Two lists in one report. Voids: every voided, non-training order, dated by when it was voided, up to 200 rows. Discounts: completed, non-training orders whose discount total is greater than zero — a ticket with no discount is not listed — again up to 200 rows.
Inventory
On-hand valuation
"Current stock with average-cost valuation." A point-in-time picture with no exclusions at all — every stock row, including zero and negative quantities. Tiles: SKUs, On hand, Reserved, Inventory value. Columns: Product, SKU, On hand, Available, Avg cost. Value is on hand × average unit cost. It reads up to 2,000 rows.
Low stock
"At or below reorder point / stockouts." An item is listed when nothing is available (on hand minus reserved at or below zero) or when it has a reorder point and availability has reached it. An item with no reorder point set and stock on the shelf is not listed. Note this uses available, while the Inventory page's own Low badge uses on hand — see Stock & holds.
Movement history
"Inventory ledger movements in range." The raw ledger, unfiltered — sales, receipts, adjustments, waste and transfers all in one list.
Waste & loss
"Spoilage, damage, shrinkage adjustments." Counts only adjustments classified as waste or loss; counts, transfers and plain corrections are excluded. Valued at average unit cost, up to 500 rows.
Dead stock
"On-hand items with no sales in the range." Anything with stock on hand that has not sold on a completed, non-training, non-voided line in the lookback window. The window is the range you set, or 90 days by default.
Because voided and training sales are ignored, an item that only ever sold on a voided ticket still counts as dead — which is the honest answer.
Purchasing
Covered in detail on Suppliers & purchase orders; in short:
| Report | Counts | Leaves out |
|---|---|---|
| Open PO aging "Open purchase orders by days past expected date." |
Approved, sent and partially received orders, aged on the quantity still outstanding. Buckets: current, 1-30, 31-60, 61-90, 91+. | Drafts, cancelled and fully received orders. Empty buckets are hidden. |
| Receipts / GRN "Goods receipts posted in range." |
Every goods receipt in the range, dated by when it was received. | Nothing — despite the name, drafts are included too. |
| Supplier spend YTD "Year-to-date PO and receipt totals by supplier." |
Ordered value from every PO not cancelled or rejected (drafts count), and received value from posted receipts only. | Cancelled and rejected orders; unposted receipts. |
| GRN variance "Cost and quantity variance on posted receipts (YTD)." |
Posted receipts, ordered by the size of the variance. Tiles: Net cost variance, Abs cost variance, Variance lines, GRNs, plus a by-supplier breakdown. | Unposted receipts. Only cost variance is stored — quantity shortages are not measured. |
Accounting
Period P&L (lite)
"Journal P&L-lite plus sales/tax/estimated margin." Two independent halves: the sales side reuses the completed non-training totals; the journal side sums journal entries in the date range for revenue, cost-of-goods and expense accounts only — assets, liabilities and equity are excluded, and accounts with nothing in them are dropped. You can narrow it to one Accounting period (optional) or leave it on "All journals in date range". The margin figure is flagged on screen as estimated and separate from the journal P&L.
Tax collected detail
"Tax by rate/jurisdiction with per-order detail." Tax recorded on completed, non-training sales, split By rate (Rate, Jurisdiction, Taxable, Tax) and then per order (Sale #, When, Rate, Taxable, Tax). Tax on a voided or training ticket never appears.
Estimated margin
"WAC-estimated margin by product and category." The strictest report in the system: completed, non-training orders; no voided lines; no return lines; and gift-card sales excluded — selling a gift card is taking money, not making a margin. Cost is estimated from each item's weighted average cost, which the screen states outright. Tiles: Revenue, Est. COGS, Est. margin, Margin %.
Gift-card sales are stripped from margin and the headline KPIs but not from daily sales or top products. That is deliberate — the money did come in — but it means margin revenue is legitimately lower than sales revenue in a week when you sold gift cards.
Cash
Drawer cash history
"Mid-shift checks, day closes, and drawer sessions." X-reports, Z-reports and drawer sessions in the range, up to 200 of each. See Cash drawer & day end for what those are.
The restaurant service report
A separate screen: Operations → Service report, headed Service. It needs the restaurant module. Ranges are Today, Yesterday and Last 7 days — measured on the clock of the machine you are reading it on, so a manager sees their own day.
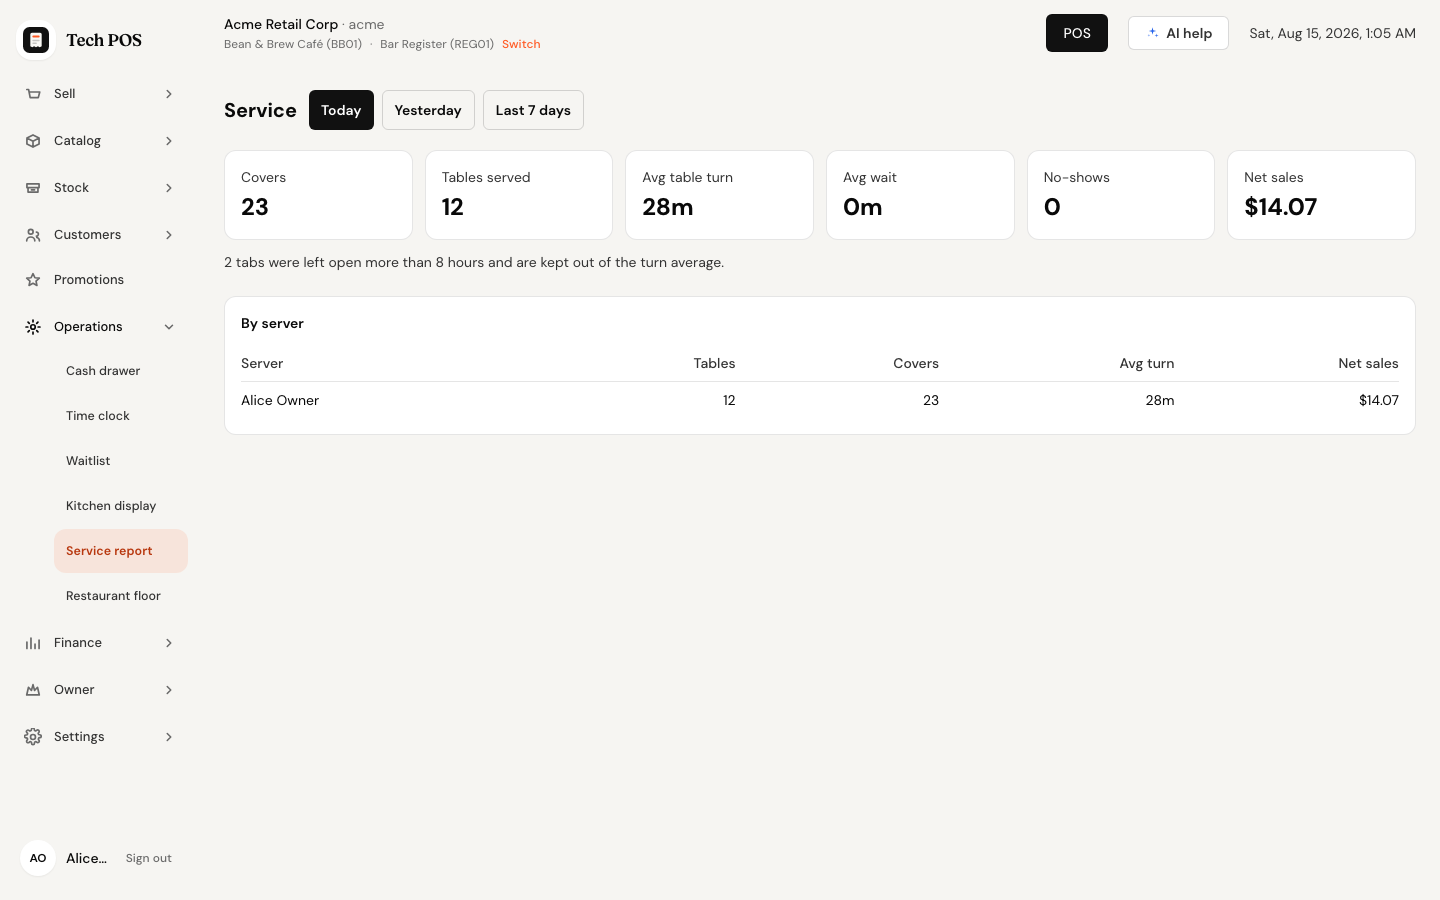
The six numbers
| Tile | What it counts |
|---|---|
| Covers | Guests seated on tables that closed in the window. |
| Tables served | Table sessions closed in the window. |
| Avg table turn | Average minutes from opening a table to closing it — with the exclusion below. |
| Avg wait | Average minutes from a waitlist quote to being seated. Parties never seated contribute nothing. |
| No-shows | Waitlist entries marked no-show. |
| Net sales | Completed order totals on those tables. A voided or still-open check contributes nothing. |
Below the tiles, By server lists Server, Tables, Covers, Avg turn and Net sales. A table with nobody assigned shows as Unassigned. With nothing closed yet you get "No tables closed in this window yet."
Only closed tables count
A table that is still occupied contributes nothing at all — not its covers, not its sales. It has no turn time yet, and counting it would drag every average toward "still going". The report is therefore a picture of finished service, and it fills in as the shift closes down.
How abandoned tabs are kept out of the turn average
Every restaurant has tabs that were forgotten at close rather than sat at for nine hours. Averaging those in turns "how fast do we turn a table" into "how long since someone tidied up".
So: a table session that lasted 8 hours or more is dropped from the turn average. It still counts as a table served, its covers still count, and its sales still count — only the turn figure ignores it.
When that happens the report tells you, right under the tiles:
"2 tabs were left open more than 8 hours and are kept out of the turn average."
The store-wide Avg table turn is not the average of the per-server averages — it is weighted by how many qualifying tables each server had, so one server with a single long table cannot skew the shop's number.
The rule is "8 hours or more". The sentence on screen says "more than 8 hours", so a tab of exactly eight hours is excluded from the average while being described as more than eight — a wording quirk worth knowing if you are reconciling by hand.
If two reports disagree
| Symptom | Usual cause |
|---|---|
| Margin revenue is lower than daily sales | Returns and gift-card sales are in daily sales and out of margin. |
| Tender totals are lower than sales totals | A payment was authorised but never captured, or a tender was voided. |
| A product is "dead" but you know it sold | It sold on a voided or training ticket, which dead stock ignores. |
| The Low stock report and the Inventory badge disagree | The report uses available (on hand − reserved) and needs a reorder point; the badge uses on hand and falls back to a threshold of five. |
| Yesterday's total changed overnight | Dates are store-local; a late-night sale belongs to the store's business date. |